Here’s how to write a case study that wins clients: choose a customer with a painful, high-stakes problem and provable outcomes; secure logo, quotes, and data permissions early; then use a 9‑step structure—outcome-first headline, context, challenge, solution, implementation, results, proof, visuals, and CTA. Validate metrics with CRM/analytics and write to your ICP’s buying triggers.
Steal this 9-step blueprint to turn projects into proof
You asked how to write a case study that actually closes deals. Below is a repeatable system used by top B2B teams—complete with templates, quote prompts, and data tips. It also works if you need to know how to write a case study on a company or how to write a case study on a business for proposals, pitch decks, or sales pages.
What a case study is—and is not
Key parts of a conversion-focused case study:
- Specific outcome and timeframe
- ICP-aligned context (industry, size, constraints)
- Verifiable metrics and methodologies
- Quotes from stakeholders who felt the problem
- Clear next step (CTA) for similar prospects
Step 0: Pick the right customer and use case
Before writing, select a story that’s most likely to move your next buyer.
Selection criteria
- Problem severity: Was the pain costly (lost revenue, churn risk, regulatory exposure, high CAC)?
- ICP match: Does the customer mirror your ideal buyer’s industry, size, and stack?
- Measurable outcomes: Can you quantify before/after with credible sources?
- Timeliness: Was the result recent enough to feel relevant (e.g., within 12–18 months)?
- Story access: Are champions willing to be named, quoted, and responsive?
Measurable checks
- Can you name the baseline (before) and the measurement window (after)?
- Do you have at least two independent data sources (e.g., CRM + billing, GA4 + product analytics)?
- Do you have role-based impact (e.g., VP Sales, RevOps, CMO) to quote?
Step 1: Secure permissions and data early
What to align on (in writing)
- Brand use: Logo, company name, and whether anonymization is needed
- Quotes: Who can be quoted (name, title) and on what topics
- Metrics: Which numbers, ranges, or indexed values are publishable
- Visuals: Screenshots, dashboards, architecture diagrams, timelines
- Review process: How many review rounds, who signs off, and by when
Data privacy and sensitivity
- Redact PII, customer lists, and internal pricing details
- Use ranges or indexed charts when precise values are confidential
- Provide methodology notes (e.g., “90‑day cohort, GA4, last non-direct click”)
Measurable checks
- You have a signed approval email or doc listing shareable assets
- You’ve scheduled stakeholder interviews and a final legal/brand review
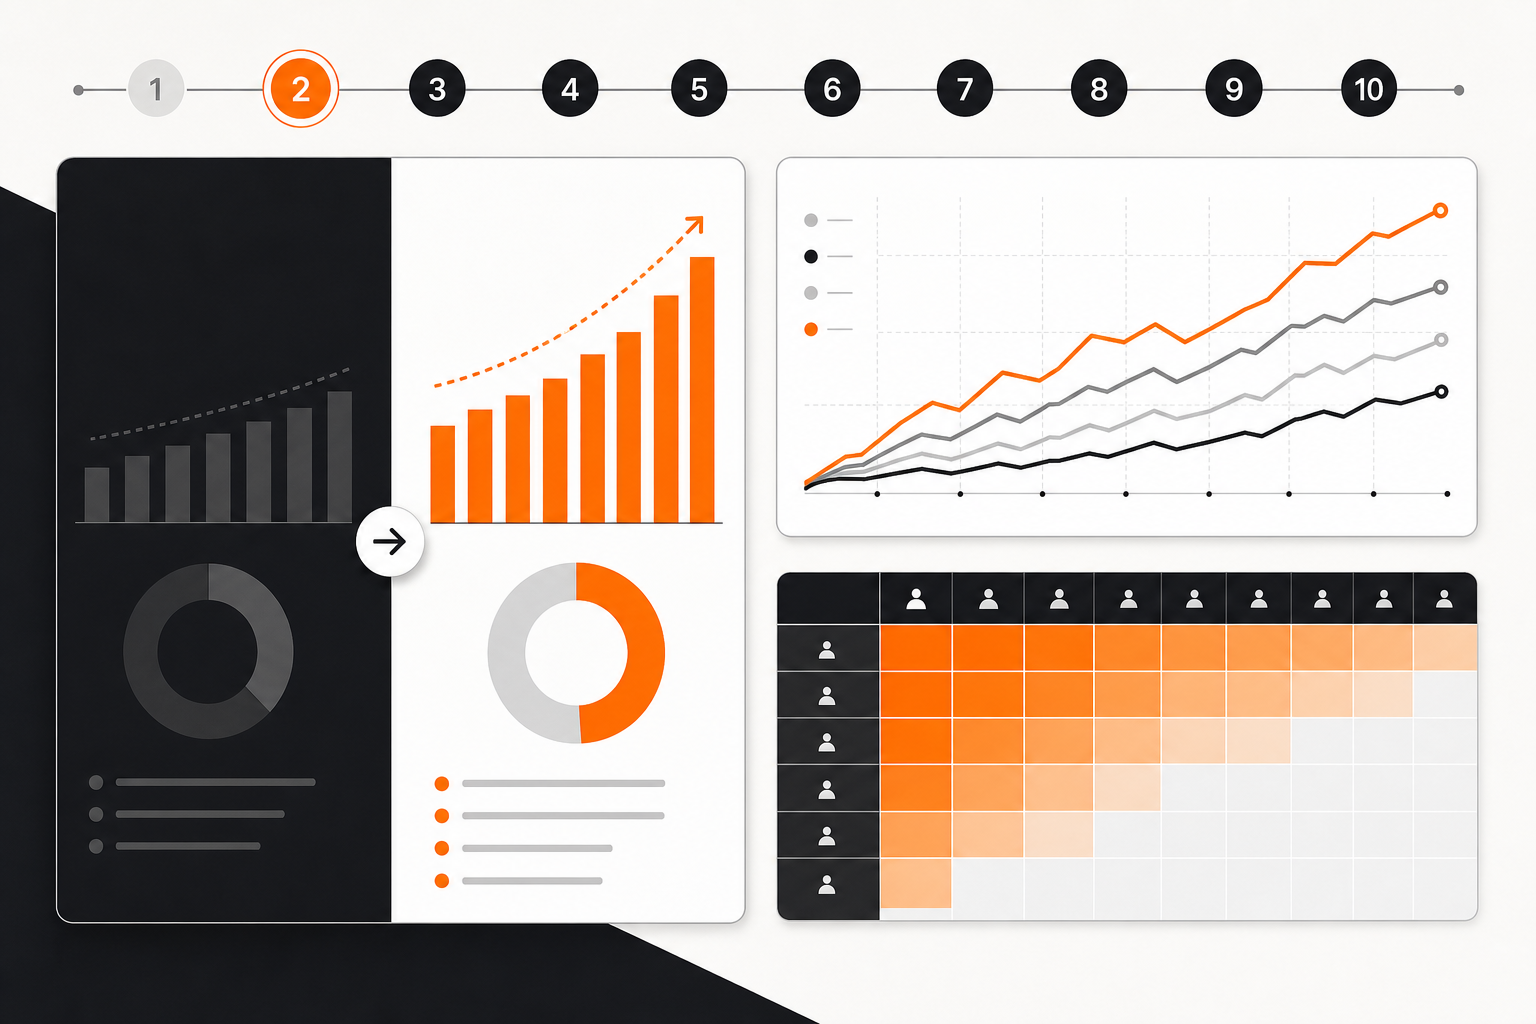
Steps 2–10: The 9-step outline that converts
1) Outcome-first headline
Formula: [Result] for [ICP] in [Timeframe] via [Approach]
- Example (template): “Cut onboarding time 47% for mid-market fintechs in 90 days via playbooks + workflow automation.”
- Keep it specific, time-bound, and ICP-relevant.
2) Context (who they are)
- 2–4 sentences on the company’s industry, size, market, and stack
- What “good” looks like in their world (seasonality, compliance, SLAs)
3) Challenge (why status quo failed)
- The trigger event (missed target, churn spike, expansion stall)
- What they tried, why it didn’t work, the cost of delay
4) Solution (what you proposed and why)
- The decision criteria and alternatives considered
- The chosen solution components and success criteria
5) Implementation (how it happened)
- Milestones, owners, and timeline
- Key technical or organizational changes; risks and mitigations
6) Results (what changed, by how much)
- Quantify primary outcome(s) first; then secondary/operational wins
- Include the timeframe and measurement method
- Use charts, cohorts, and confidence qualifiers when needed
7) Proof (voices and artifacts)
- Quotes from buyer, user, and exec levels
- Screenshots, architecture diagrams, or before/after workflows
8) Visuals (make scanning effortless)
- Pull-quotes, callouts, and annotated charts
- Section labels aligned to buyer questions (Problem, Path, Payoff)
9) CTA (one logical next step)
- “See the demo,” “Talk to an expert,” or “Download the playbook used”
- Surface ICP filters (“For B2B SaaS with 50–500 reps…”) to qualify clicks
Measurable checks
- Headline states a numeric result and timeframe
- Results section includes baseline, window, and data source(s)
- Quotes address both emotion (risk, relief) and logic (criteria, ROI)
Interview guide and quote prompts
Stakeholders to interview
- Economic buyer (e.g., CMO, CRO, VP Ops): business impact, risk, tradeoffs
- Power user (e.g., RevOps lead, Program Manager): implementation, workflows
- Executive sponsor (e.g., CEO, COO) or cross-functional partner: strategic fit
Quote prompts (copy/paste)
- “Walk me through the moment you realized the status quo wouldn’t work.”
- “What did you risk by not acting in that quarter?”
- “When evaluating options, what almost disqualified us?”
- “Describe the first tangible win the team noticed.”
- “If you had to defend this decision to your CFO, what’s your one-slide story?”
- “What changed for your team’s day-to-day after go-live?”
- “If you were advising a peer, what would you tell them to watch out for?”
Measurable checks
- You captured at least three direct quotes per role
- Each quote ties to a stage (Challenge, Solution, or Results)
Data, metrics, and validation (no hand-waving)

Pick decision-driving metrics
- Revenue and pipeline: ARR/MRR, SQLs, win rate, cycle length
- Efficiency: time-to-value, time saved per task, cost per acquisition
- Quality: error rate, NPS/CSAT, retention, activation, adoption
- Operational: deployment time, incident count, SLA adherence
Make metrics defensible
- Show the baseline and the measurement window (e.g., Q2 vs Q4)
- Attribute causality cautiously (note concurrent initiatives)
- Use cohorting where appropriate (e.g., new-customer cohort vs. total base)
- Cross-check sources (CRM + billing; GA4 + product analytics)
Simple formulas and labels
- Percent change: (After − Before) ÷ Before
- Time saved: (Old time − New time) × Frequency
- Cycle reduction: Old days to close vs new days; show medians if outliers
Evidence callout
Evidence beats hype. Publish only what you can support with: system screenshots (redacted), exported reports with filters shown, named stakeholder quotes, and a short methodology note (e.g., “GA4, 90-day lookback, last non-direct click”). When exact figures are sensitive, use ranges (20–30%) or index charts (baseline = 100).
Measurable checks
- At least one primary and two secondary metrics are reported
- Every metric lists the source system and time window
Formatting and design that sell the story
Layout
- Lead with a stat bar (3–4 top outcomes) under the headline
- Keep each section scannable: 3–5 sentences, one visual, one quote
- Use descriptive subheads: “Pipeline grew 22% in 90 days,” not “Results”
Visuals to include
- Before/after workflow or architecture diagram
- Time-series chart (baseline to outcome)
- Role-based quote cards (buyer, user, exec)
- Pullout with the implementation timeline
Accessibility and polish
- Plain-language labels, high-contrast colors, alt text for images
- Avoid jargon; define terms the first time you use them
Examples to learn from (patterns, not numbers)

- HubSpot Customer Stories: Clear outcomes up top, buyer-friendly language, and role-relevant quotes
- Salesforce Trailblazer stories: Strong industry context and stakeholder perspectives across roles
- AWS case studies: Organized by industry and solution, with architecture visuals that reduce technical risk perception
Study the structure and scanning patterns; emulate the clarity and role alignment without copying brand voice or design.
Common pitfalls and limits to watch
- Vague outcomes: “Improved efficiency” without a number or timeframe
- Vanity metrics: Pageviews without conversion context or goal alignment
- One-source data: Only a slide from an internal deck without system exports
- Survivor bias: Feature only outliers; publish a representative mix by segment
- Over-attribution: Ignore seasonality, pricing changes, or parallel initiatives
- Legal delays: Write before permissions and spend months waiting for sign-off
Measurable checks
- You can defend every figure with a source and method
- You’ve included constraints or caveats that matter to a peer buyer
Distribution: get your proof in front of buyers

Where and how to use it
- Website: Industry or use-case hubs; link from solution pages
- Sales: One-page PDF, 6–8 slide deck variant, and 30‑second talk track
- Paid and ABM: Snippets as proof modules in ads and landing pages
- Product marketing: In demos, feature tours, and onboarding playbooks
- PR and analyst relations: As supporting evidence when briefing firms
CTA alignment
- Top-of-funnel: “Read the full story” + related playbook
- Mid-funnel: “See how it works in a 15‑minute demo”
- Bottom-of-funnel: “Map this to your stack with our solution architect”
Complete template (copy, paste, customize)
- Headline: [Result] for [ICP] in [Timeframe] via [Approach]
- Subhead: One-sentence summary with baseline and source
- Stat bar: 3–4 KPIs with timeframe and data source
- Context: Company, market, stack
- Challenge: Trigger, cost of inaction
- Solution: Decision criteria, chosen approach
- Implementation: Milestones, owners, timeline
- Results: Primary and secondary outcomes, methods, caveats
- Proof: Buyer + user + exec quotes
- Visuals: Workflow, chart, timeline
- CTA: Role-specific next step
If you’re writing for a company or a business specifically
If you’re wondering how to write a case study on a company or how to write a case study on a business, keep the same 9 steps but add:
- Org chart snippet to show stakeholders and decision flow
- Procurement and security notes (for enterprise buyers)
- Financial framing (budget range, payback assumptions)
- Change management highlights (training, adoption, policy updates)
Final quality check (10-minute audit)
- Does the headline state a numeric result and timeframe?
- Can a skeptical buyer verify each metric’s source and window?
- Do quotes answer “Why now?” and “Why you?”
- Is there a single, logical CTA aligned to the reader’s stage?
- Would the customer proudly share this on their LinkedIn?
---
Evidence-led bottom line: The fastest path to a case study that wins clients is choosing a severe, ICP-matched problem; securing shareable data and quotes early; and writing to a disciplined, outcome-first outline that a skeptical buyer can verify.
Common questions
Frequently asked questions
What’s the ideal length for a B2B case study?
Aim for 700–1,000 words for web, plus a one-page PDF and a 6–8 slide deck version. Keep sections scannable with a stat bar, one visual, and one quote per section.
How do I get permission to publish client logos and metrics?
Send a short approvals doc listing brand use, quotes, metrics (exact or ranges), visuals, and the review process. Get written sign-off from legal/brand owners before drafting.
Which metrics make a case study most credible?
Lead with decision-driving outcomes: revenue or pipeline impact, cycle time, cost, and quality. Always show the baseline, timeframe, data source, and a brief methodology note.
How can I write a case study if results are confidential?
Use ranges (e.g., 20–30%), index charts (baseline = 100), and redacted screenshots. Anonymize the brand if needed and include a clear methodology to maintain credibility.